Here is a list of abbreviations we use in our signals and what they mean. I will try to fit the actual words in the text but I often abbreviate due to limited space.
WS30 = Wall ST. 30
USSC2000 = U.S. Small Cap 2000
TP = Take Profit. This is the area that you want to close your trade at a profit.
SL = Stop Loss. This is the area you want to close your trade at a loss.
WO = Working Order. If we send our a price level to buy or sell at and it is not where the market currently is, Nadex will place this trade in a working order window to fill at a later time.
BS = Bull Spread Trade
BO = Binary Option Trade
B/E = Break Even
@ = "At" a certain price
Also, Below are a few guide lines to remember:
If we set a TP @ 16540 and price is at 16535, you do not have to message me to ask if it is ok to take your profits now. If you want to take your profits, go ahead but I will let you know when I am taking mine.
Please do not message me to ask me what I think the market will do. I dont know what the market will do. I never have and never will.
If I send out a signals such as this... BUY WS30 16500-16900@16510 and the market currently is at 16505, then YES YOU CAN BUY IT AT 16505 because it is a cheaper price. Anything between there we say buy it and the floor/ceiling is an ok price to buy or sell.
So anywhere between 16510 and 16500 would be an ok area to buy
If i say to sell the 16500-16100@ 16480 and price is currently at 16490, then sell it because you got 10 points of a better price than we did.
The exception to this rule is that it must be within a few minutes of when we send the signal. You can not wait around all day and do it because it will not work then.
Alrighty, thats it. You have a great day!! forex trading on td ameritrade
Hit 10 pips profit 75% of the time within 2 hours... often leading to hundreds of pips...
We have an indicator in development for the use of bull spreads in Nadex, for forex trades, and also for binary options Nadex trades. Below are the testing and results. First, I will post pictures of the indicator in action in the live market. The arrows did not repaint in any form. What you see is how they came in the live market.
A member of our group supplied all the information here. I am just recompiling it for you in an easy to read format. This is not my work but rather the awesome and inspiring work of our member, Nick. One of the great things about Joaquin Trading is the fact that we all work together for the good of the group as a whole! We all share ideas with each other and it is fantastic.
So below are a few charts of the indicator in action. The red arrows signify buying opportunities and the red arrows signify selling opportunities. We will try to capture 20 pips of profit on half of the position and then move our stop loss to break even to let the other half ride for larger moves.
To see a larger picture of a chart, just click it. To see the actual excel profit/loss statistics, scroll to the bottom and to see it in google sheets, just click on the link at the bottom.
If this is something you are interested in using for your own trading, just CLICK HERE!
All of these signals were using a setting on the indicator that looks at the trends in the market from 5 minute, 15 minute, 30 minute,and 1 hour time frames.
What I will post below are the actual emails from Nick and I will also include a spreadsheet he made available with statistics detailed from each day of testing. Here come the emails...
I wanted to let you know how I am testing your Bull Spread Indicator, and I want to get your opinion to determine if my strategy is any good or not.
I know you haven’t really come up with any rules for this indicator, so I came up with some rules of my own for testing.
I am testing making money 3 different ways:
1) to get 10 pips profit 2) to get 20 pips profit 3) to make an ATM Binary Options trade
The rules I am using are:
1) Take 2 bull spread contracts when the trend arrow appears 2) Take a BO ATM contract at the same time (1 hour options >> if the signal comes out between 9:00 and 9:45, take 10:00 Expire/after 9:45 take 11:00 exp) 3) Close out one of the bull spread contracts when it makes 10 pips 4) Close out the second bull spread contract when it reaches 20 pips 5) Close out either bull spread contract when it either reaches -20 pips or hits the 2 hour mark
One thing I am also doing different than you, is that I might take an additional set of trades if I get a new set of arrows in the same direction (if I have already closed out a previous set of trades). For example, I get a trend arrow at 10:00 AM and it makes me 10 pips at 10:10 and 20 pips at 10:25. At 10:40, I get a new trend arrow in the same direction, so I start the process all over again. (This is outside of what you would do, so it’s probably more risky.)
SO I back tested this strategy for the week of April 20-24. It did excellent on the historical test.
Total winning $ (not taking into account spreads and commissions) = 2908.00
Obviously, taking spreads and commissions into account, the total winning $ would probably drop by 10-20%.
The first week of testing was almost “too good to be true”. I feel that the results from this week are more realistic.
Also, please be aware that the “losses” are not all unprofitable. If a bull spread hit the 2 hour mark and did not make 10 pips (but made 7), I would classify that trade as a loss, even though it actually made a little money.
As you always ask, is this a winning system? From what I have looked at so far, the answer is YES.
One thing I have noticed, is that the indicator spits out almost all of the trades between 12AM and 12PM. The arrows that pop up between 12PM and 12AM usually dont work as well (though I did not exclude them from my test). The arrows also work the best when there is movement in the market. The market didn’t move much on Monday May 4, so the profits were very small that day.
In my testing (9 days) there wasn’t a losing day. And this week, each of the 3 types of trades did not have a losing day. So if you only took 10 pip win trades, you would have been profitable every day (and the same was true for the other 2 types of trades).
So this is why I am excited about this new indicator. I have been interested in bull spreads for a long time, because I just hate risking 80.00 to win 20.00 on Binary Options. If the market spikes on you just once in 5 trades, you end up trading all day for nothing. I have done OK with the trend arrows and V5, but I want to trade with less risk involved.
Thanks,
Nick ****** =========================================================================
Hi Ryan,
I did my study on all 8 currency pairs that have Nadex Bull Spreads, using the 1M charts. I did not actually make any trades (demo or real), but tracked all of the results on paper.
I will send you the screenshots here shortly. (which are posted above)
Thanks for taking the time to read my e-mail. Hopefully I was able to help you understand how I was testing. The rules I kind of “made up” from rules that you had used in other strategies.
It all looks good on paper….but will it work in actual trading? That’s what I intend on finding out next week.
Although no trading system can solely rely on RSI indicator, using it in combination with other tools and proper technical analysis can bring a new edge to your Forex trading.
Setup:Currency pair: Any. Time frame: Any. Indicator: RSI (14) with levels at 70 and 30.
Entry rules: Buy when RSI has crossed below 30, formed a bottom, and then crossed back up through 30. Entry rules: Sell when RSI has crossed above 70, formed a peak, and then crossed back down through 70.
Exit rules: not set.
Advantages: RSI is a very good indicator to refer for confirmation for any entry in any simple or complex trading system. For current trading method it advices well on entries, but opportunities occur not that often.
Disadvantages: monitoring is needed, still false signals take place. Strategy is suggested to be used in combination with other ones.
You have no idea how many emails I get about trading services being absolute garbage. I hear story after story about how many companies are just scam artists. So I had a thought... I will contact several trading companies I know about and ask them to show their stuff live on camera for a day. I did this for several reasons. 1. If a trading signal company is legit, they will have no problem showing off what they have to offer. 2. This is also to show a little snippet of how each company does things. 3. I wanted to offer a free look inside the daily trade calls of different services because many traders are reluctant to try a new service at all. They have been reamed by scam artists for so long that they trust no one. Now I sent many companies offers to participate. The majority turned me down. Several of these companies had a reason for doing so. Just because they are not on the list below does not mean they are scam artists. The companies below are the ones willing to participate so I commend them for being confident in their services. On Tuesday April 28, these companies will open up their services for free for everyone for a few hours. There are no log in credentials or free trial sign ups. Just click on the Live Feed URL and watch them in action. And when its over, its over.
Ok guys, we have a little schedule for that day. There will be several live feeds. I dont know the end times as each company can end their feed whenever they feel the need to do so but I do have start times for you. Also I have no control over what each company chooses to share with you. If you have questions about their service, please contact them directly. Dont contact me unless you are asking about Joaquin Trading because I cant speak for anyone but myself. This will take place April 28, 2015 1. Alpha Trading Signals Our first participant is Joshua Murakami who runs Alpha Trading Signals. He will be calling trades that will be posted in Nadex Trading Ideas around 5:30-6:30pm Eastern on Monday Night, April 27, the night before. These trades should expire on Tuesday April 28. Contact him at https://www.facebook.com/joel.murakami 2. Slick Trade Our Second Participant is Slick Trade. They will begin their feed around 7am Eastern on Tuesday April 28. The URL to the feed is https://zoom.us/j/5194900922 so all you need to do to see what they have to offer is just click on the link and watch. You may contact Slick Trade by visiting http://slicktrade.net/ 3. Joaquin Trading Our third participant is Joaquin Trading. We will begin our feed at 9:30am Eastern on Tuesday April 28. We will be focusing on the 5 minute binaries on Nadex and showing buy/sell signals right there on the screen all day long. Our live feed URL is https://www.uberconference.com/joaquintrading so just click the link and start watching. You can visit us at joaquintrading.com 4. TWT Our fourth Participant is TWT. They will begin their live feed at any time on Tuesday April 28. Just click this link https://zoom.us/j/4427149930 and you can watch to see how Trey does it. You can contact TWT by sending Trey a message on facebook at https://www.facebook.com/trey.redd 5. Traden Our fifth participant is Traden. They will begin their live feed at 12pm Eastern on Tuesday April 28. If you want to see how they roll, justc click the link here https://zoom.us/j/3023511868 around lunch time. You can visit traden here https://www.tradengroup.com/
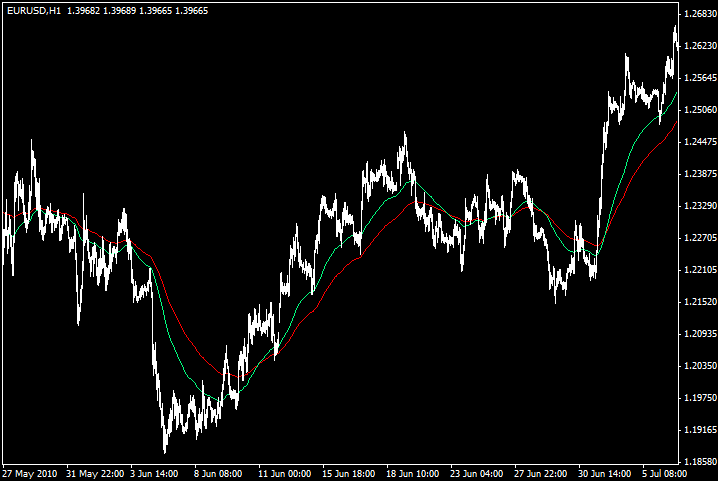
Indicators: 100Ema applied to close and 28 smooth moving average applied to close. Time frame: 1hr and 4hr Currency: Any, but i guess Eur/usd would be preferable. Entry: the 100ema shows the trend. So if we were in a down trend as given by the 100ema and a candle closes above the 100ema, we enter a buy, you would stay in that buy until a candle closes below the 28 and re-entriesare made using the 28 once price touches it or closes above it when it has first closed below it. The reverse is for a sell trade.
For 1hr, stop loss should be 50-60pips while take profit should be 70-120pips, for 4hr stop loss should be 100pips while take profit should be 100-500pips.
Here I will recap our trades for this week. If you took every signal, this will show how our profits and losses happened. On some trades, some clients got filled at different prices but all I can show is the exact signals.
Monday July 28- Buy WS30>16830 (4:15pm) for $50. We took profit at $95 at 1:25pm. Profit = $45 Buy US Small Cap 2000>1145.0 (WEEKLY) for $41 Profit for the day = $45
Tuesday July 29-
Sell WS30 bull spread16500-1690 415pm @ 16495. We took a slight profit.. Profit = $3
Buy WS30>16890 for $50. (This trade went down to $49 and then shot to 95 in about 15 minutes.. Some clients had their entry set at 55 got filled at this price and took profit at $95. I did not get filled because I kept my entry at 50. Even though some clients got filled, I can not include this in my daily P/L)
Profit for the day = $3
12:21 pm Sell US TECH100>3950 WEEKLY for $55
After Nadex opened back up at 6PM, We took these trades and held them all night.
Buy WS30 daily 16900-17300 @ 16914
sell US500 daily 500 1920.0-1960.0@ 1958.2
Wednesday July 30 - We took profit of $24 on both bull spreads. Profit = $48. Some clients didnt take profit at $24 but held and made more. Some clients didnt take profit and lost both for a net loss of -$32 Profit for the day = $48 Sell US Tech 100>3950 (WEEKLY) for $55 Thursday July 31- We closed US Tech WEEKLY Sell Position for $10. Profit = $45 Buy WS30>16700 for $50. Closed at a loss -$30 Buy WS30>16640 for $50. Closed at a loss -$25 Loss for the day = ($10) Friday Aug 1 - Our Weekly US Small Cap 200>1145 expired OTM. Loss = $41 Buy DAILY US500 1930-1970 @ 1931. Took profit @+$30 Sell WS30 8am-415p 16100-16400 @ 16389. Took prfit @ +$17 Profit for the day +$6
Total P/L for the week = +$92 Trading 5 contracts = $460 Trading 10 contracts = $920 Trading 25 contracts = $2,300 Thoughts about this week... Even though we were profitable, there was a time this week that I was just in misery. On Thursday, the DOW dropped something like 317 points. We were trying to buy on a dip. Lucky for us, we were in a binary trade and only lost a small amount. Losses happen. When they do, try not to beat yourself up. I spent the whole day with an upset stomach because I had lost my clients their money. But as I tell them all, in the end, it will be ok...and it was. Take each trade but do not focus on it. One trade is just one trade. You look at the end of the week or end of the month and you will be fine. Here is to another successful week! Things I need to focus on... Often when I send out signals, some clients have told me they didnt know exactly what I mean. So yesterday, I started streamlining the "wording" to make it a bit easier. I think that is fixed but I will continue to strive to be as clear as possible. To my clients... You are all awesome! Thank you and feel free to ask me questions about anything you dont understand.