Currently, gold prices have fallen about 1299 targets as expected. The next targetis1291. However, prices in 1291 will face strong resistance. Details as follows: 1. Fibonacci rectracement : 161.8% 2. Fibonacci expansion : 138.2 % 3. White trend line
This Straegy is based on the same study of defining support and resistance levels and trading upon the fact of their violation.
A trading setup requires only an open chart and no restrictions for the currency or timing preferences.
Entry rules: Once the price makes it through the “pivot Line” - dotted white line on the figure below (drawn using the latest price peak) - and closes above (for uptrend) or below (for downtrend) the line buy/sell accordingly.
Exit rules: not set. However, exit can be found using Fibonacci method; or traders can measure the distance between point 2 and point 3 and project it on the chart for exit.
Additions: as an additional tool traders can use MACD (12, 26, 9). The rules for entry then will be next - let’s take a SELL order: When MACD lines cross downwards, you look for 1-2-3 set-up to form. When the price starts “attacking” the “pivot Line” you check that MACD is still in SELL mode (two lines are heading down). Once the price closes below the “pivot Line” – place Sell order.
Gold is revised down match what is expected of me. Today there are 2 important fundamental news affecting prices. Thats news index GDP and Unemployment Claims. Both basic information are expected good for the health dollar. So, I think todays gold prices will continue downward adjustment. Trading Strategy : Sell limit : 1418 Stoploss : 1424 Take Profit : 1396 Price at time of writting : 1407 usd/oz Hope luck ! :)
Gold has faced strong sell forces at the 1406 Markets serial rally on Friday when the prices soared from 1397 to 1406 opening. But at while in town , gold has faced strong sell forces at the 1406, make the price down to under 1400usd/oz quickly, sometimes has to come 1390usd/oz . Today, I think gold will have adjustments on the lower level. The long term trend, I think gold prices will conquer milestone 1466usd/oz in September. Strategy : Sell stop : 1395 - 1400 Stop loss: 1408 Take Profit : 1380 - 1375 Hope luck !:)
You can review the medium-term trading strategy released August 25,2014 . It was going to be 2/3 the way complete and accurate! I have closed the price trades at 1275.80 .
Right now Im waiting for the signal to buy gold. Gold trading strategy medium-term : Buy limit: 1265 - 1270 USD/oz Stop loss: 1258 USD/oz Take Profit: 1300 USD/oz
Yesterday, the main trend is bearish for gold prices. However, in the zone of 1247 - 1249, gold prices met resistance from the trendline support. Trend line defined on D1 time frame, is drawn from the value of 684 USD/oz (October 2008) and 1,179 USD/oz (December 2013).
Gold trading strategy release September 10,2014. Price trends: fell before rising back. Strategy: Buy limit: 1252.50 - 1254.50 USD/oz Stop loss: 1248.30 USD/oz Take Profit: 1264.30 USD/oz
Use time frame and currency which respond the best (1 hour, 1 day… or any other).
Indicators: (multiple of 7) 7 SMA, 14 SMA, 21 SMA.
Entry rules: When 7 SMA goes through 14 and continues through 21, BUY/SELL in the direction of 7 SMA once price gets through 21 SMA.
Exit rules: exit when 7 SMA goes back and touches 21 SMA.
Advantages: again it is an easy set up and does not require any calculations or other studies. Can produce very good results during strong market moves, the system also can be easily programmed and traded automatically.
Disadvantages: System requires periodical monitoring according to a chosen time frame. SMA indicator signal can be confirmed after the current price bar has been fully formed and closed. In other words, when SMA stops changing and the signal is fixed, traders may rely on such information to open a trade.
This is a good simple strategy. I have traded it myself on a demo account with great success. It involved looking at the daily charts and drawing trend lines. A trend line must connect to at least two points. It is important that the trend line doesn’t have any breaks between the two points it connects to. Here is an example:
As trend lines are often used as support and resistance points, the market often bounces and sometimes even reverses at them. The way we can use this to our advantage is by placing buy or sell orders at the trend lines. We can place a stop just below the trend line, but ensure you leave enough room for volatility. If the trend line holds you can either set a TP at a support or resistance point or use a trailing stop. I like trailing stops personally. If the trend line breaks you take a small loss, but if it holds as they so often do you have a good chance of a winning trade that greatly exceeds the risk you took. You can see how this happened on the 3rd point of the trendline in the chart above. If you had placed a buy order at this point, it would have been a very nice, low risk trade.
People who have not experienced much in Forex trading. This strategy specifically for these gentlemen is a very useful thing.
After working for several months on this strategy we can say this with full confidence. You can Earn a good profit Daily with this Strategy.
This strategy is very simple and easy to use.
Account Type: Any Micro Account. Broker : Any Broker.
How to Use This Strategy: We Provide all information about this strategy when you buy this No loss strategy. Also you will be guide with the help of Skype. and we provide a training video. If you want to ask any question. Feel free to contact with us on instaforexreal@gmail.com Skype: Geynstuff
Proof : This is only 5 Days Trades History.
All Trades Close Automatically. All Trades Targets Hit Automatically.
This not a Robot this is a Real earning way.
Deposit : 500$ After 5 Days Belance :1057.60 Total Profit : 526.13
Dont waste time and dont waste your money. Get this strategy and Earn Real Money.
Payment Process: Skrill, Perfect Money Pay only one time:200$ Lifetime opportunity, Golden Chance Feel free to contact with us on instaforexreal@gmail.com Skype: Geynstuff Please note: if you are not satisfied after learn. we will not refund the payment.
One of my new video. Video for forex trading without indicators. Below are 7 steps practice: Step 1: Open meta trader4 and first press the key combination CTRL+Y. Step 2: Marked the Monday. This method isnt traded on the Monday. Step 3: Determine the highest point and the lowest point of the 7 candles and drawing two horizontal lines to mark. Step 4: Determine break out. Step 5: Trading and profit. Video:
I will make a video about the situation, entry point, SL point, TP point. Subscribe my video channel and wait for part 2. Thank you !
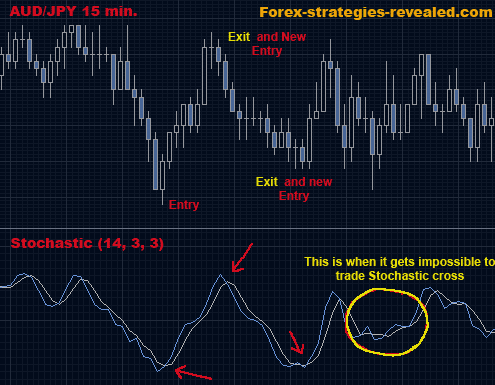
Forex systems which adopt a Stochastic indicator for monitoring the price provide some very good tips about the situation on the market for traders that are willing to see it.
Currency pair: Any. Time frame: Any. Indicator: Full Stochastic (14, 3, 3)
Entry rules: When Stochastic has crossed below 20, reached 10, and then crossed back up through 20 – set BUY order. Entry rules: Sell when Stochastic has crossed above 80, reached 90, and then crossed back down through 80. Exit rules: close trade when Stochastic lines rich the opposite side (80 for Buy order, 20 for Sell order).
Advantages: gives quite accurate entry/exit signals in well trending market. Disadvantages: needs periodical monitoring. Stochastic is suggested to be used along with other indicators to eliminated entering on false signals.
The two indicators we are going to talk about here are found to be very well working when used side by side. This Forex trading system is an another simple discovery; and hundreds of such discoveries can be made when traders are there to learn and experiment.
Any currency pair and time frame can be used. Indicators: Parabolic SAR default settings (0.02, 0.2), ADX 50 (with +DI, -DI lines)
Entry rules: SELL When the +DI line is below the -DI line, and Parabolic SAR gives sell signal. When the +DI line is above the -DI line, all Parabolic sell signals must be ignored. Entry rules: BUY when the +DI line is above the -DI line, and Parabolic SAR gives buy signal. When the +DI line is below the -DI line, all Parabolic buy signals must be ignored. Exit rules: when +DI line and -DI lines have crossed again.
Advantages: allows filtering entries and predicting good exits.
Disadvantages: Both Parabolic SAR and ADX are follow-up indicators. Although they complement each other very effectively, the “weakest” in chain is ADX, because during trading it can give one signal, but later change to the opposite. Once given a signal from ADX, waiting for the current price bar to close to avoid such misleading is advised.
Current Forex trading system represents a well thought and very simple combination of indicators. Knowing what signal to look for with each indicator, provides a strong tip for good entries and exits.
Time frame: Any. Currency: Any. Indicators: 5 EMA, 10 EMA, Stochastic (14, 3, 3), RSI (14, 70, 30)
Entry rules: Buy when 5 EMA crosses above 10 EMA and Stochastic lines are heading north (up) and Stochastic is not in overbought position (above 80.00 level) and RSI is above 50.
Entry rules: Sell when 5 EMA crosses below 10 EMA and Stochastic lines are heading south (down) and Stochastic is not in oversold position (below 20.00 level), and RSI is below 50. Exit rules: when 5 EMA and 10 EMA cross in the opposite direction or if RSI crosses the 50 mark again.
Today I found out a new robot which has been recently released into the forex automated trading arena. This trading system - called turbo-robot - promises to deliver consistent profits with unrivaled profitability, low draw downs, diversification and overall, just awesome results. Within this post I intend to review this trading system, specially the evidence provided by the author and whether or not this evidence is able to backup the authors claims of profitability. I will also look into this evidence and through my analysis tell you if I think the system has the potential to be long term profitable. After evaluating all these different aspects of the strategy I will then conclude my review by telling you whether or not this trading system is worth buying and testing. Is the turbo-robot up to the challenge of forex automated trading ? Lets see.
The turbo-robot website starts with the usual speech telling you how most robots suck but this robot is the best you will ever find. The author points out that the problem is that people should look for consistent profits and not systems that just make profits and then wipe accounts. Then when we turn to look at the evidence this system may have to prove that it is actually profitable we find nothing but the usual faulted tests.
This forex automated trading system offers backtesting results as the only proof of profitability. However not only does the author only offer these tests but the statements from the tests are not actually shown so things as simple as the actual time period of the tests, the average risk to rewards ratio, maximum draw down, etc, become absolutely useless. Then we are faced with something even worse which is the fact that the modeling quality of the tests is not 90% but n/a. This means that the simulations are not accurate since either 1 minute data was not used for modeling or a lot of mismatch errors occur within the test.
The author then shows us a part of the backtests which are supposed to be a part of the graphs shown. We do find that the system has a very favorable 1:5 risk to reward ratio which is absolutely great for any trading system. However since we do not have access to the actual backtesting statements it becomes absolutely impossible to determine whether or not this is the average risk to reward ratio or just the outcome of a few trades.
There is also an additional problem pointed out by the people at project4x which say that the backtesting results are NOT reproducible and that actual reproduction with 90% modeling quality generates nothing but loses. I think that this not surprising given the fact that the tests made available by the author of the turbo-robot website do show an n/a modeling quality pointing out that the results shown by them are the result of errors introduced within the data (or the lack of accurate data) and therefore their tests are nothing but meaningless and useless.
I believe that the people who setup this website and put up the tests are either very ignorant of how automated trading systems work and how to run simulations or they are doing an elaborate and conscious effort to deceive buyers. In either case the lack of any investor access verified live trading results and the lack of back testing statements does point out that the sellers are not being fully open but absolutely dishonest with the websites visitors. In the end, the overwhelming lack of any reliable evidence and the absolute lack of completness and accuracy of the evidence presented I consider this system NOT worth buying or testing. In the future, I would recommend the people at turbo-robot to consider their audience less retarded and do their homework regarding proper backtesting and the ABSOLUTELY necessary posting of FULL backtesting statements and investor access verified live trading results. If they are not willing to risk their own money on their own "wonderful" system, why should you ?
If you would like to learn more about my teachings in automated trading and how you too can design and trade your own long term profitable systems based on realistic profit and risk targets please consider buying my ebook on automated trading or joining Asirikuy to receive all ebook purchase benefits, weekly updates, check the live accounts I am running with several expert advisors and get in the road towards long term success in the forex market using automated trading systems. I hope you enjoyed the article !
Here is a very basic overview of a role of a Stochastic indicator in the Forex trading. Knowing exactly what to expect from Stochastic, if you ever plan to add it to your own system, will affect trading results dramatically. For this trading method:
Currency pair: Any.
Time frame: Any.
Indicator: Stochastic (14, 3, 3)
Entry rules: Buy when the faster moving Stochastic line crosses above and up over slower moving stochastic line.
Exit rules: Sell when the opposite situation (next crossover) occurs and right after that open an opposite position. It is again recommended, once the first touch of Stochastic lines (possible future crossover) has been spotted, to wait until the following price bar on the chart has closed and only then take actions.
Advantages: can give entry and exit rules, easy to use.
Disadvantages: Stochastic is a lagging indicator – with this lines crossover system it can create a lot of false signals. Traders may want to change Stochastic regular settings for each particular currency pair to eliminate as many false signals as possible. Stochastic crossover system is good when used in combination with other indicators.